
Design Decisions
Saheed. A. Busari
RADAR is a lightweight modelling language and tool for analysing software requirements and architecture decisions (Busari and Letier, 2017). This report presents an application of RADAR to the analysis of ambulance management systems.
Our analysis is motivated by and based on an enquiry report about the London ambulance system failure (Finkelstein et al., 1996) and a goal model developed for the London Ambulance Service (Letier et al., 2004; Letier et al., 2011).
The Ambulance Management System (AMS) deploys personnels (i.e. the ambulance crew) to an emergency location where there is an accident (Letier et al., 2011). Typically, the ambulance crew is supposed to arrive at the incident location within 14 minutes from when an incident was reported.
Design decisions for the ambulance management systems include:
the incident form encoding method for encoding details about the calls, from the public, that reports an emergency. The incident encoding method can be the current paper-based method, or computer-based method, or the use of automated encoding using call location mechanism, or a combination of the computer-based method with automated call location method.
the ambulance location method to locate an idle ambulance to be deployed to incident location. The ambulance location method can be the current radio and paper-based method, or the use of an automated vehicle location method.
the ambulance allocation method for dispatching the nearest ambulances to an incident location. This method can be the current paper-based allocation method , or an interactive allocation method or a fully automated allocation method.
the mobilisation communication method to facilitate communication of the ambulance crew and the station the incident was reported. This method can either use a radio or mobile data terminal for communication.
the number of deployed ambulances in the city. There are 100 ambulances currently deployed but this number can be either be 120, 140, 160, 180 and 200.
These design decisions (shown below) have impacts on the crew's response time to an incident and the cost-effectiveness of the ambulance management system.
Design Decisions
Automating all or parts of the ambulance management system will improve the performance of the system (e.g. ambulance response time). However, there is uncertainty about the cost and benefit of automation.
Two key concerns of an ambulance management system are to minimise the response time for an ambulance to intervene an incident and to minimise the total costs, which comprises the cost of incident encoding, cost of mobilising ambulances, cost of locating and allocating ambulances.
The first object of minimising ambulance response time is equivalent to maximising the benefits of using ambulance management system, where the benefits are defined as the difference between the revenue and the total cost:
Objective Max ExpectedNetBenefit= EV(Benefit);

Benefit = Revenue - Cost;

Revenue = normalCI(100000, 200000);
This objective formulation as a maximisation of expected benefits instead of minimisation of expected loss is more convenient for RADAR's information value analysis.
We model the second objective as minimising the risk defined here as the probability that the ambulance response time exceeds 14 minutes (14*60 in seconds) of the reported incident:
Objective Min Risk = Pr(ResponseTime > 14*60);
The 14 minutes is a UK Government standard (Letier et al. 2004, 2011).
The ambulance RepsonseTime is the sum of the time taken to mobilise the ambulance, the travel time of the ambulance and possibly the delay an ambulace faced during travel.
ResponseTime = AmbulanceMobilisationTime + MobilisedAmbulanceTravelTime + MobilisedAmbulanceDelay;
The AmbulanceMobilisationTime is the sum of the incident call taking time, ambulance allocation time and the mobilisation communication time
AmbulanceMobilisationTime = IncidentCallTakingTime + AmbulanceAllocationTime + MobilisationCommunicationTime;
The IncidentCallTakingTime depends on the incident form encoding mehod used; If the current paper-based method is used, then the call taking time follows an exponential distribution with a mean of 60 seconds; If the conputer-based method is used, then the call taking time has an exponenttial distribution with mean time of 40 seconds; if the automated call location method is selected, then the call taking time has exponential distribution with a mean value of 45 seconds; and if the computer-based and automated call location method is used, then the call taking time follows an exponential distribution with a mean time of 30 seconds.
IncidentCallTakingTime = decision("Incident Form Encoding Method"){
    "Current Paper-Based":exponential(60);
    "Computer Based":exponential(40);
    "Automated Call Location":exponential(45);
    "Computer-Based and Automated Call Location":exponential(30);
}
The Ambulance Allocation Time depends on the ambulance allocation method; If the current paper-based method is used, then the ambulance allocation time follows an exponential distribution with a mean of 60 seconds; If the interactive allocation method is used, then the allocation time has an exponenttial distribution with mean time of 20 seconds; if the allocarion is fully automated automated, then the allocation time has exponential distribution with a mean value of 5 seconds.
AmbulanceAllocationTime = decision("Ambulance Allocation Method"){
    "Current Paper-Based":exponential(60);
    "Interactive Allocation":exponential(20);
    "Fully Automated Allocation":exponential(5);
}
The Mobilisation Communication Time depends on the mobilisation communication method; If the current radio-based method is used, then the mobilisation communication time follows a triangular distribution with a lower and upper bounds of 45 and 90 seconds respectively, and a most likely time of 60 seconds; If a mobile data terminal system of a specific model type A is used, then the allocation time has a triangualar distribution with a lower and upper bounds of 20 and 40 seconds respectively, and a most likely time of 30 seconds; if a different mobile data terminal system of another model type B is used, then the mobilisation communication time has a triangular distribution with a lower and upper bounds of 10 and 20 seconds respectively, and a most likely time of 15 seconds.
MobilisationCommunicationTime = decision("Mobilisation Communication Method"){
    "Current Radio-Based":triangular(45, 60, 90);
    "MDT-System A":triangular(20, 30, 40);
    "MDT-System B":triangular(10, 15, 20);
}
The Mobilisation Ambulance Travel Time is the ratio of the distance the mobilised ambulance has to travel to the average mobilised ambulance speed.
MobilisedAmbulanceTravelTime = MobilisedAmbulanceDistance/ MobilisedAmbulanceAverageSpreed;
The mobilised ambulance distance is the sum of the mobilised ambulance distance from the incident location and an error margin when locating the ambulance.
MobilisedAmbulanceDistance = MobilisedAmbulanceDistanceFromLocation + MobilisedAmbulanceLocationErrorMargin;
Since ambulances can be at different location, we assume the mobilised ambulance to be within some distance from the incident location. Hence we say the mobilised amabualce distance from location follows a normal distribution with confidence interval between 10000km and 100000km.
MobilisedAmbulanceDistanceFromLocation = normalCI(10000,100000);
The mobilisation ambulance location error margin depends on the ambulance location method; if the current radio and paper-based method is used, then the error margin follows a normal distribution with a mean of 60km and standard deviation of 120km; if the automated vehicle location method of model type A is used, then error margin has a normal distribution with a mean and standard deviation of 45km and 60km respectively; if a different automated vehicle location of model type B is used, then the error margin has a normal distribution with a mean and standard deviation of 20km and 60km respectively.
MobilisedAmbulanceLocationErrorMargin = decision("Ambulance  Location Method"){
    "Current Radio and Paper-Based":normal(60, 120);
    "Automated Vehicle Location A":normal(45, 60);
    "Automated Vehicle Location B":normal(20, 60);
}
MobilisedAmbulanceAverageSpreed = triangular(30, 50, 70);
MobilisedAmbulanceDelay = normalCI(0, 120);
The cost is the sum of the ambualance mobilisation cost and the cost of ambulances:
Cost = AmbulanceMobilisationCost + CostOfAmbulance;
CostOfAmbulance = (NbrAmbulances - CurrentNbrOfAmbulance) * UnitCost + AnnualMaintenanceCost;
CurrentNbrOfAmbulance =  deterministic (100);
UnitCost = triangular (5000, 7000, 10000);
The number of ambulances depends on the whether additional amabulance are deployed. The number of ambulances currently deployed is 100.
NbrAmbulances = decision("Additional Ambulance"){
    "Current_100_Amb" : deterministic(100);
    "120_Amb" : deterministic(120);
    "140_Amb" : deterministic(140);
    "160_Amb" : deterministic(160);
    "180_Amb" : deterministic(180);
    "200_Amb" : deterministic(200);
}
AnnualMaintenanceCost = decision("Additional Ambulance"){
    "Current_100_Amb" :triangular (5000, 7000, 10000);
    "120_Amb" : triangular(1000, 1500, 2000);
    "140_Amb" : triangular(1500, 2000, 2500);
    "160_Amb" : triangular(2000, 2500, 3000);
    "180_Amb" : triangular(2500, 3000, 3500);
    "200_Amb" : triangular(3000, 3500, 4000);
}
The ambulance mobilisation cost is the sum of the cost of incodent form encoding and the cost of locating an idle ambulance:
AmbulanceMobilisationCost = CostOfIncidentFormEncoding + CostOfLocatingAmbulance;
CostOfIncidentFormEncoding = decision("Incident Form Encoding Method"){
    "Current Paper-Based":triangular(150,200,250);
    "Computer Based":triangular(100, 150, 200);
    "Automated Call Location":triangular(50,100,120);
    "Computer-Based and Automated Call Location":triangular(10, 50, 100);
}
CostOfLocatingAmbulance = decision("Ambulance  Location Method"){
    "Current Radio and Paper-Based": triangular (400, 500, 600);
    "Automated Vehicle Location A":triangular (300, 400, 500 );
    "Automated Vehicle Location B": triangular (200, 300, 400);
}
The AND/OR refinement graph for the response time model and the cost model looks like this:

And/Or refinement graph for the response time and cost
Here is a summary of the modelling and analysis information:
| Objective | MaxExpectedNetBenefit | ||||||
| Objective | MinRisk | ||||||
| SolutionSpace | 648 | ||||||
| Minimal SolutionSet | 648 | ||||||
| Shortlisted | 5 | ||||||
| Nbr. Variables | 22 | ||||||
| Nbr. Parameters | 31 | ||||||
| Nbr. Decisions | 5 | ||||||
| Runtime(s) | 0 |
The model analysis generates the following shortlist of Pareto-optimal solutions:
| ID | Incident Form Encoding Method | Ambulance Allocation Method | Mobilisation Communication Method | Ambulance Location Method | Additional Ambulance | Risk | ExpectedNetBenfit |
|---|---|---|---|---|---|---|---|
| 1 | Automated Call Location | Current Paper-Based | Current Radio-Based | Automated Vehicle Location B | Current_100_Amb | 0.13 | 142611.97 |
| 2 | Computer-Based and Automated Call Location | Current Paper-Based | Current Radio-Based | Automated Vehicle Location B | Current_100_Amb | 0.13 | 142648.85 |
| 3 | Current Paper-Based | Current Paper-Based | Current Radio-Based | Current Radio and Paper-Based | Current_100_Amb | 0.12 | 142302.11 |
| 4 | Current Paper-Based | Current Paper-Based | Current Radio-Based | Automated Vehicle Location A | Current_100_Amb | 0.12 | 142402.35 |
| 5 | Current Paper-Based | Current Paper-Based | Current Radio-Based | Automated Vehicle Location B | Current_100_Amb | 0.12 | 142501.89 |
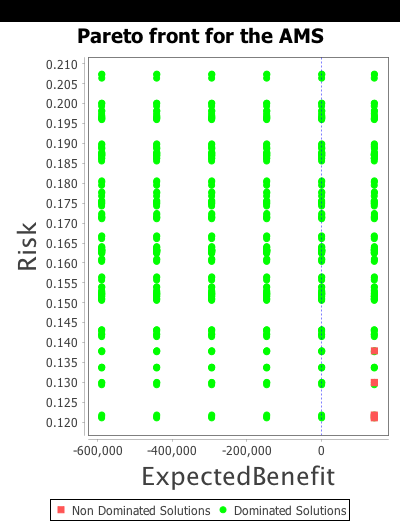
Figure 4: Ambulance management system model pareto front
These results show that all shortlisted solutions include the paper-based option, radio-based option and the option to maintain the number of ambulances at 100. This implies that, in our model, the paper-based option outperforms the interactive and fully automated options of the ambulance allocation method. Also, the radio-based option outperforms the MDT-system of the ambulance mobilisation method. However, given that these two options are selected, the optimal solutions consist of all possible combinations of incident encoding methods and ambulance allocation methods; each com processing on both objectives.
But once these two options are selected, the shortlist includes all possible combinations of fraud detection methods and alert thresholds; each combination representing a different tradeoff between maximising expected net benefit and minimising risk.
To visualise such tradeoffs, RADAR generates the graph in Fig. 4 plotting the objective values for the shortlised solutions (shown squares at the top of the graph) and all other non shortlisted ones (shown as circles).
Analysing information value gives the following results:
EVTPI = 0
| Objective | ExpectedNetBenefit |
| EVTPI | 0 |
| Parameter | EVPPI |
| Revenue | 0 |
| IncidentCallTakingTime[Current Paper-Based] | 0 |
| IncidentCallTakingTime[Computer Based] | 0 |
| IncidentCallTakingTime[Automated Call Location] | 0 |
| IncidentCallTakingTime[Computer-Based and Automated Call Location] | 0 |
| AmbulanceAllocationTime[Current Paper-Based] | 0 |
| AmbulanceAllocationTime[Interactive Allocation] | 0 |
| AmbulanceAllocationTime[Fully Automated Allocation] | 0 |
| MobilisationCommunicationTime[Current Radio-Based] | 0 |
| MobilisationCommunicationTime[MDT-System A] | 0 |
| MobilisationCommunicationTime[MDT-System B] | 0 |
| MobilisedAmbulanceDistanceFromLocation | 0 |
| MobilisedAmbulanceLocationErrorMargin[Current Radio and Paper-Based] | 0 |
| MobilisedAmbulanceLocationErrorMargin[Automated Vehicle Location A] | 0 |
| MobilisedAmbulanceLocationErrorMargin[Automated Vehicle Location B] | 0 |
| MobilisedAmbulanceAverageSpreed | 0 |
| MobilisedAmbulanceDelay | 0 |
| UnitCost | 0 |
| AnnualMaintenanceCost[Current_100_Amb] | 0 |
| AnnualMaintenanceCost[120_Amb] | 0 |
| AnnualMaintenanceCost[140_Amb] | 0 |
| AnnualMaintenanceCost[160_Amb] | 0 |
| AnnualMaintenanceCost[180_Amb] | 0 |
| AnnualMaintenanceCost[200_Amb] | 0 |
| CostOfIncidentFormEncoding[Current Paper-Based] | 0 |
| CostOfIncidentFormEncoding[Computer Based] | 0 |
| CostOfIncidentFormEncoding[Automated Call Location] | 0 |
| CostOfIncidentFormEncoding[Computer-Based and Automated Call Location] | 0 |
| CostOfLocatingAmbulance[Current Radio and Paper-Based] | 0 |
| CostOfLocatingAmbulance[Automated Vehicle Location A] | 0 |
| CostOfLocatingAmbulance[Automated Vehicle Location B] | 0 |
The results show that the information value of all model parameters is very low.
Saheed A. Busari and Emmanuel Letier, "RADAR: A lightweight tool for requirements and architecture decision analysis," in International Conference on Software Engineering (ICSE), 2017
A. Finkelstein and J. Dowell, "A comedy of errors: the London Ambulance Service case study," International Workshop on Software Specification and Design (IWSSD), 1996, pp. 2-4.
A. van Lamsweerde and E. Letier, "Handling Obstacles in Goal-Oriented Requirements Engineering," IEEE Transactions on Software Engineering, vol. 26, no. 10, pp. 978–1005, Oct. 2000.
W. Heaven and E. Letier, "Simulating and optimising design decisions in quantitative goal models," 19th IEEE International Requirements Engineering Conference (RE 2011) , IEEE, 2011, pp. 79–88.