Design Decisions
Saheed. A. Busari and Emmanuel Letier
RADAR is a lightweight modelling language and tool for analysing software requirements and architecture decisions (Busari and Letier, 2016). This report presents an application of RADAR to the analysis of plastic card fraud detection systems.
Our analysis is motivated by and based on previous studies of the scalability of a commercial fraud detection system (Duboc et al., 2008; Duboc et al. 2013) and of the performance criteria of plastic card fraud detection tools (Hand et al., 2008).
The purpose of a plastic card fraud detection system is to detect when plastic card accounts have been compromised by fraudsters who are using the account to steal funds (Hand et al, 2008).
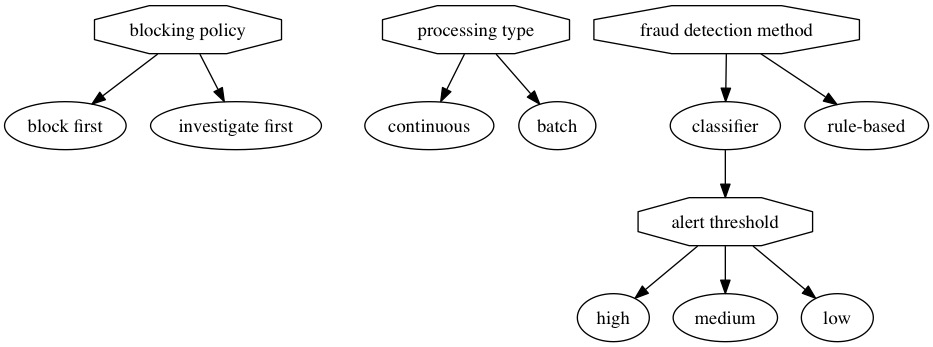
Design decisions for fraud detection systems include:
the processing type that can be continuous or batch; continuous processing analyses transactions individually, whereas batch processing analyses sets of transactions together;
the fraud detection method which can be a two-class supervised classification method in which a classifier is trained from past samples of fraudulent and non-fraudulent transactions, or a non-statistical rule-based method that flags transactions matching configurations known to be high risk;
if the classifier fraud detection method is chosen, the alert threshold defines some threshold above which the classifier should flag a transaction as suspect; a low alert threshold means more alerts will be generated and thus a higher ratio of false alerts;
the blocking policy that can include blocking an account as soon as the fraud detection algorithm flags a transaction as fraudulent, or only blocking the account after the suspected fraud has been confirmed by human investigators.
These design decisions (shown below) have impacts on how quickly frauds are detected and compromised accounts blocked and on the cost-effectiveness of the fraud detection system.
Design Decisions
The current system analyses transactions in batch using a rule-based method. Accounts are blocked only after the suspected fraud has been confirmed by human investigators.
Two key concerns of a fraud detection system are to minimise the financial loss due to fraud and to minimise the manual fraud investigation costs.
The first object of minimising financial loss is equivalent to maximising the benefits of using a fraud detection system, where the benefits are defined as the reduction in financial loss with respect to the current system's baseline:
Objective Max FraudDetectionBenefit= EV(Benefit);

Benefit = BaseLineFinancialLoss - FinancialLoss;

BaseLineFinancialLoss = deterministic(500000);
This objective formulation as a maximisation of expected benefits instead of minimisation of expected loss is more convenient for RADAR's information value analysis.
We model the second objective as minimising the alert investigation load defined here as the 95th percentile of the number of alerts generated by the fraud detection system:
Objective Min InvestigationLoad = percentile(NbrAlerts, 95);
The percentile means that 95 days out of 100, the number of alerts will be below the investigation load.
This plastic card fraud detection system analyses transactions after they have been authorised by the bank. Therefore, if the fraud detection system detects a transaction as fraudulent, the bank will still lose the fraudulent transaction amount (unless the bank can prove the fraud is due to negligence from the cardholder or vendor, a concern we will not consider in our model). The purpose of the fraud detection system is to block compromised card accounts as quickly as possible so as to prevent further fraud. Plastic card fraud detection system are thus evaluated by their ability to minimise future financial losses.
We model the future financial loss as the product of the number of compromised accounts, the average number of fraudulent transactions that will be authorised on an account before it is blocked, and the average value of a fraudulent transaction:
FinancialLoss = NbrCompromisedAccounts
                    * NbrFraudPerAccountBeforeBlocked
                    * AverageFraudValue;
The FinancialLoss is measured in £ per day, NbrCompromisedAccounts in number of accounts per day, and AverageFraudValue in £.
The number of compromised accounts is the total number of accounts multiplied by the percentage of compromised accounts:
NbrCompromisedAccounts = NbrAccounts * CompromisedAccountRatio;
Both quantities are parameters that can be estimated from past data. For example:
NbrAccounts = normalCI(0.9 * 10^6, 1.1 * 10^6);
CompromisedAccountRatio = triangular(0, 0.0001, 0.0003 );
The average fraudulent transaction value can also be estimated from past data. For example:
AverageFraudValue = normalCI(100, 1000);
The average number of frauds on an account before it is blocked, NbrFraudPerAccountBeforeBlocked, depends on the blocking policy. If accounts are blocked as soon as the fraud detection system suspects a fraud, the number of fraud before the account is blocked is the number of fraud before detection. If accounts are blocked only after suspected fraud are confirmed by a fraud investigation, further frauds might occur during investigation:
NbrFraudPerAccountBeforeBlocked = decision("blocking policy"){
    "block first"          : NbrFraudBeforeDetection;
    "investigate first"    : NbrFraudBeforeDetection + NbrFraudDuringInvestigation;
}
The average number of frauds before detection, NbrFraudPerAccountBeforeBlocked, depends on the processing type.
For continuous processing, the mean number of fraud before detection is the infinite series:
  1 * probability(fraud is detected after 1 fraudulent transactions)
+ 2 * probability(fraud is detected after 2 fraudulent transactions)
+ 3 * probability(fraud is detected after 3 fraudulent transactions)
+ ...
The probability that a fraudulent transaction is detected is the true alert rate (the ratio of the number of detected fraud over the number of fraud). Factoring the above series yield that for continuous processing
NbrFraudBeforeDetection = 1/ TrueAlertRate
In batch processing, transactions are analysed at the end of every day. Batch processing thus introduces a delay between a fraudulent transaction and its detections, a delay during which additional fraud might occur, but because transactions are analysed in groups rather than individually, the batch processing may have a better true alert rate than the continuous processing. Assuming that batch processing adds on average a delay of a day to fraud detection, our models assumes that
NbrFraudBeforeDetection = NbrFraudsPerCompromisedAccountPerDay * 1/ Batch_TrueAlertRate
Thus, the final equation for estimating NbrFraudBeforeDetection is:
NbrFraudBeforeDetection = decision("processing type"){
    "continuous"    :    1 / ContinuousTrueAlertRate;
    "batch"         :    NbrFraudPerCompromisedAccountPerDay / BatchTrueAlertRate;
}
The average number of frauds per day per compromised account is a parameter than could be estimated from past data. For example:
NbrFraudsPerCompromisedAccountPerDay = normalCI(1, 20);
The average number of fraud per account committed during the investigation period is also proportional to the number of frauds per compromised account per day.
NbrFraudDuringInvestigation = NbrFraudPerCompromisedAccountPerDay * InvestigationDelay;

InvestigationDelay = triangular(1/24, 1/3, 1);
The true alerts rates depend on the fraud detection methods and their parameters. True alerts rates are typically estimated by analysing the performance of the fraud detection method on past data.
To keep our model simple, we assume the classifier has three settings high, medium, and low that generates high, medium, or low number of alerts; and the rule-based approach has a single fixed true alert rate.
For the continuous true alert rate:
ContinuousTrueAlertRate = decision("fraud detection method"){
    "classifier" :  ContinuousAlertThreshold;
    "rule-based" :  deterministic(0.75);
}

ContinuousAlertThreshold = decision("alert threshold"){
    "low"   : triangular(0.75, 0.85, 0.95);
    "medium" : triangular(0.65, 0.75, 0.85);
    "high"    : triangular(0.55, 0.65, 0.75);
}
For the batch true alert rate:
BatchTrueAlertRate = decision("fraud detection method"){
    "classifier" :  BatchAlertThreshold;
    "rule-based" :  deterministic(0.80);
}

BatchAlertThreshold = decision("alert threshold"){
    "low"   : triangular(0.75, 0.85, 0.95);
    "medium" : triangular(0.65, 0.75, 0.85);
    "high"    : triangular(0.55, 0.65, 0.75);
}
The AND/OR refinement graph for the financial loss model looks like this:
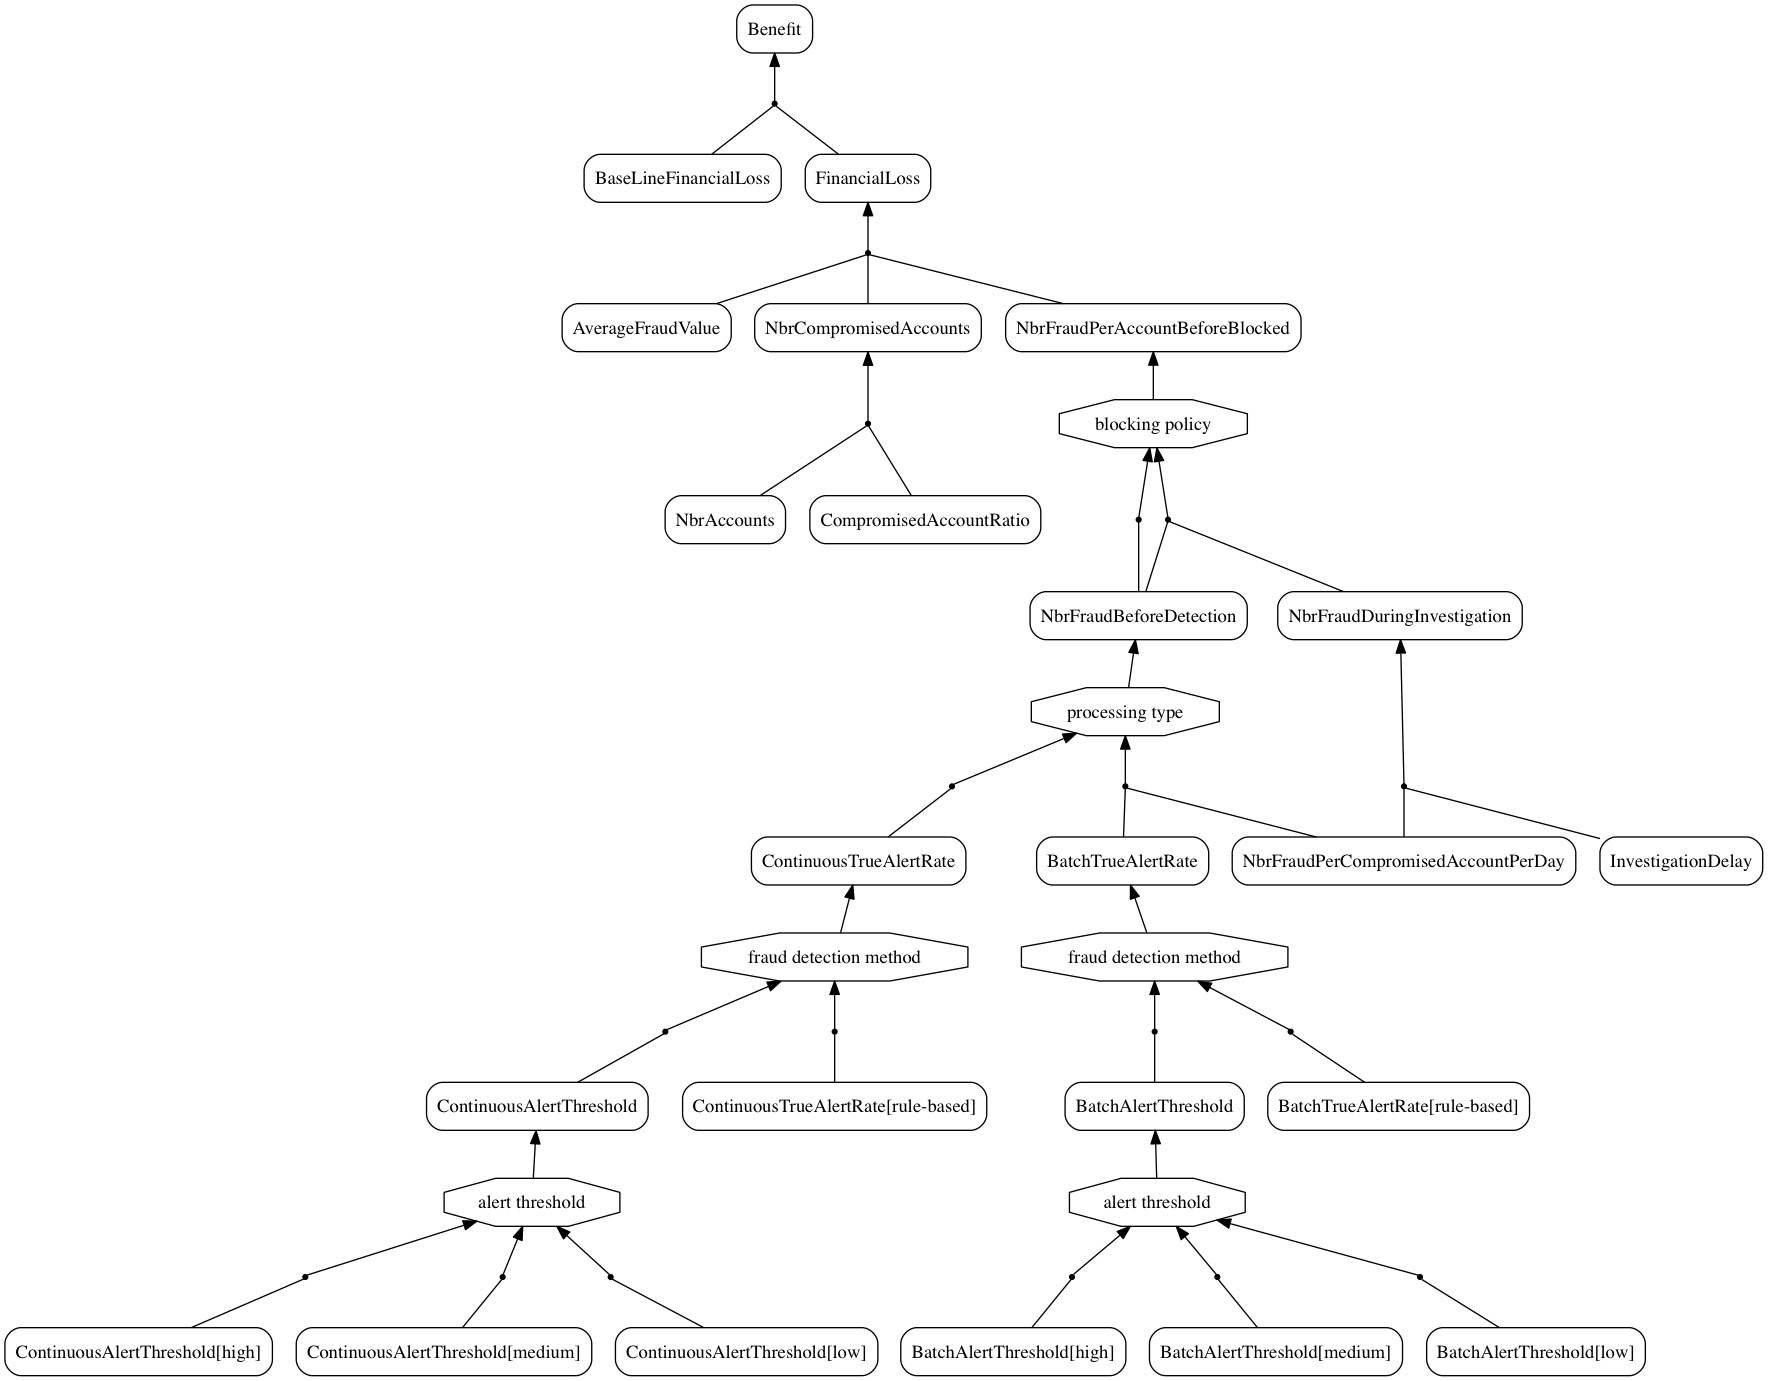
Financial Loss And-Or Refinement Graph
The number of generated alerts is the sum of the number of true alerts and false alerts:
NbrAlerts = NbrTrueAlerts + NbrFalseAlerts;
The number of true and false alerts are functions of the number of accounts, the percentage of compromised accounts, and the true and false alert rates:
NbrTrueAlerts = NbrFraud * TrueAlertRate;
NbrFalseAlerts = NbrLegitTransactions * (1 - TrueNegativeRate);
The true alert rate (the ratio of the number true alert over the number of fraud, a.k.a. sensitivity) and true negative rate (the ratio of the number of un-flagged legitimate transactions over the total number of legitimate transactions, a.k.a. specificity) vary with the processing type:
TrueAlertRate = decision("processing type"){
    "continuous" : ContinuousTrueAlertRate;
    "batch"      : BatchTrueAlertRate;
}

TrueNegativeRate = decision("processing type"){
    "continuous" : ContinuousTrueNegativeRate;
    "batch"      : BatchTrueNegativeRate;
}
Models of the continuous and batch true alert rates have already been defined. The models for the continuous and batch true negative rate follow the same structure:
ContinuousTrueNegativeRate = decision("fraud detection method"){
    "continuous_classifier" :  ContinuousClassierTrueNegativeRate;
    "continuous_rule-based" :  deterministic(0,99);
}

ContinuousClassierTrueNegativeRate = decision("continuous classifier threshold level"){
    "low"   : triangular(0.95, 0.99, 0.995);
    "medium" : triangular(0.99, 0.995, 0.999);
    "high"    : triangular(0.995, 0.999, 0.9999);}

BatchTrueNegativeRate = decision("fraud detection method"){
    "batch_classifier" :  BatchClassifierTrueNegativeRate;
    "batch_rule-based" :  deterministic(0,995);
}

BatchClassifierTrueNegativeRate = decision("batch classifier threshold level"){
    "low"   : triangular(0.9, 0.99, 0.995);
    "medium" : triangular(0.99, 0.995, 0.999);
    "high"    : triangular(0.995, 0.999, 0.9999);
}
Finally, the number of fraudulent and legitimate transactions depend on the number of accounts and average number of transactions per account:
NbrFraud = NbrAccounts * CompromisedAccountRatio * NbrFraudPerCompromisedAccountPerDay

NbrLegitTransactions = NbrAccounts  * NbrLegitTransactionsPerAccountPerDay
The average number of accounts and compromised account ratio are model parameters that we have already estimated above. The average number of legitimate and fraudulent transactions per compromised account per day are also model parameters that could estimated from past data. For example:
NbrFraudPerCompromisedAccountPerDay  = triangle(0, 3, 10)
NbrLegitTransactionsPerAccountPerDay = triangle(0, 3, 10)
The And/Or refinement graph for the investigation load model looks like this:
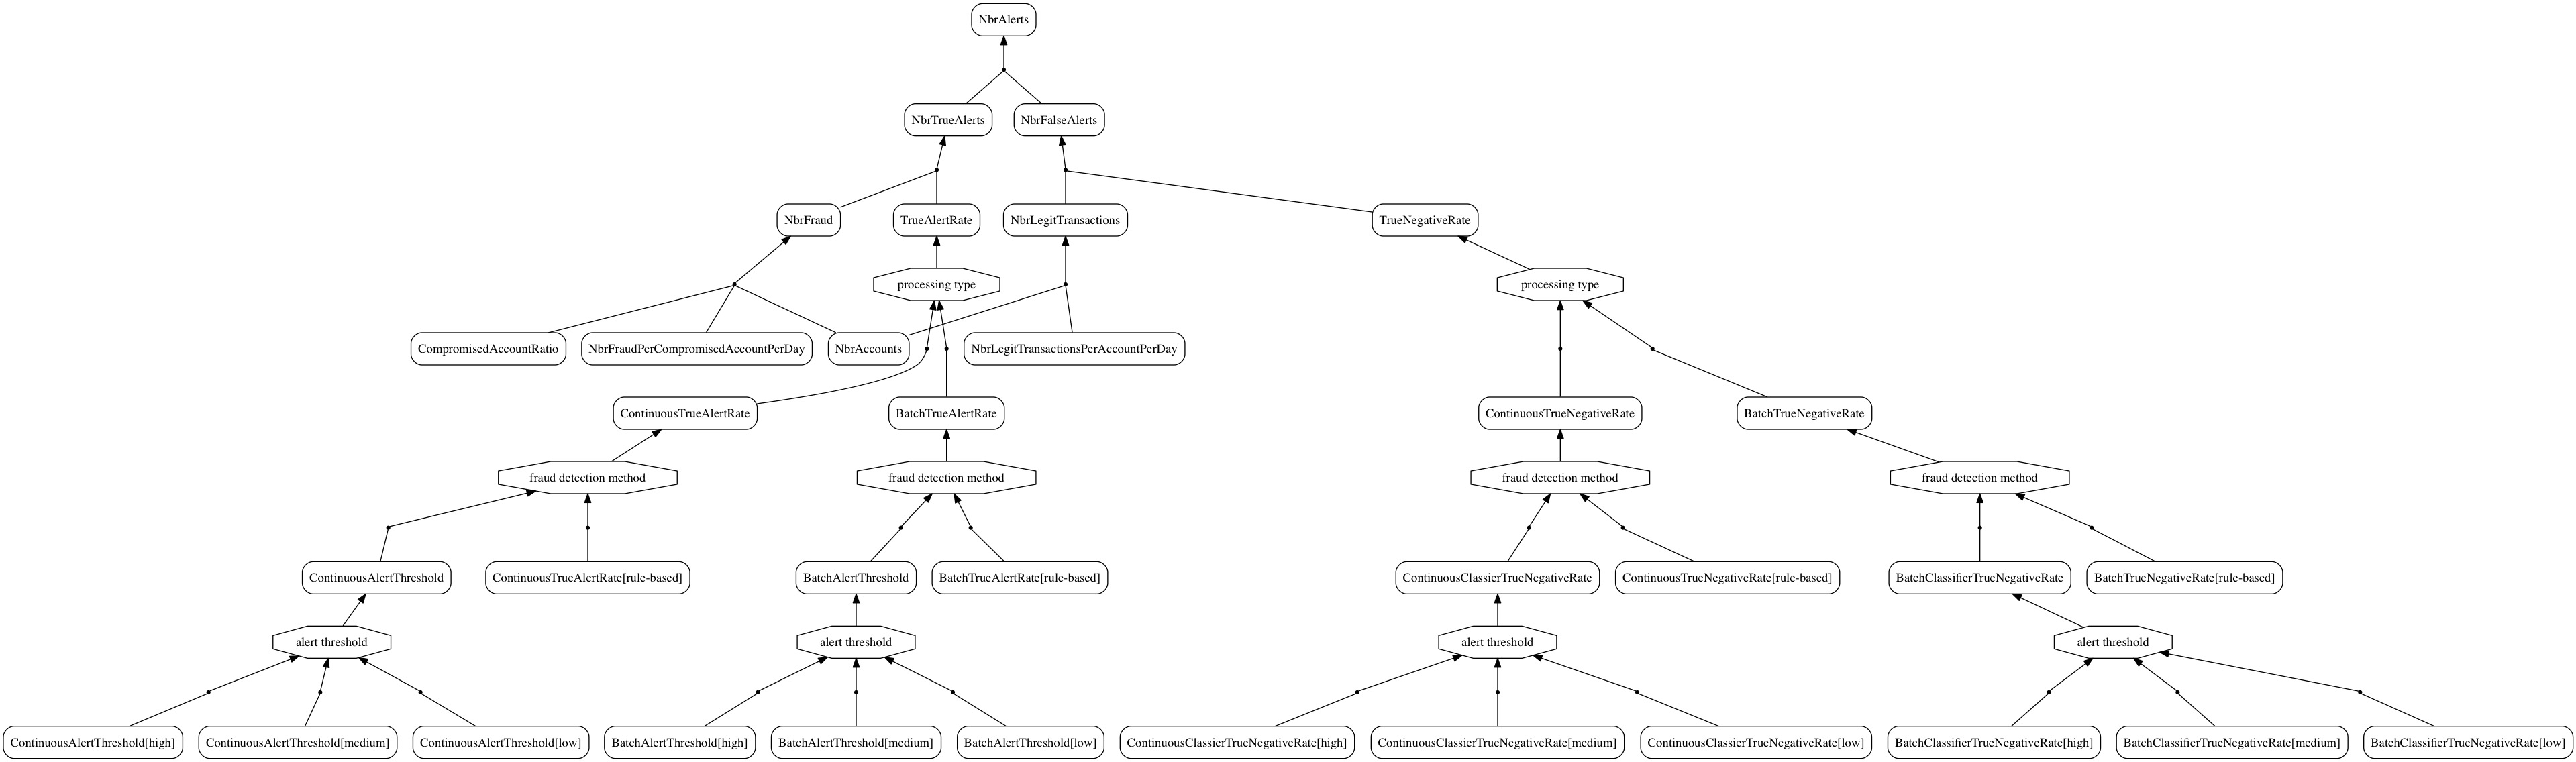
And/Or refinement graph for the investigation load model
Here is a summary of the modelling and analysis information:
| Objective | MaxFraudDetectionBenefit | ||||||
| Objective | MinInvestigationLoad | ||||||
| SolutionSpace | 24 | ||||||
| Minimal SolutionSet | 16 | ||||||
| Shortlisted | 4 | ||||||
| Nbr. Variables | 31 | ||||||
| Nbr. Parameters | 19 | ||||||
| Nbr. Decisions | 4 | ||||||
| Runtime(s) | 0 |
The model analysis generates the following shortlist of Pareto-optimal solutions:
| ID | blocking policy | processing type | fraud detection method | alert threshold | FraudDetectionBenefit | InvestigationLoad |
|---|---|---|---|---|---|---|
| 1 | block first | continuous | rule-based | 402799 | 82709 | |
| 2 | block first | continuous | classifier | medium | 402516 | 52139 |
| 3 | block first | continuous | classifier | high | 387394 | 22467 |
| 4 | block first | continuous | classifier | low | 414087 | 232479 |
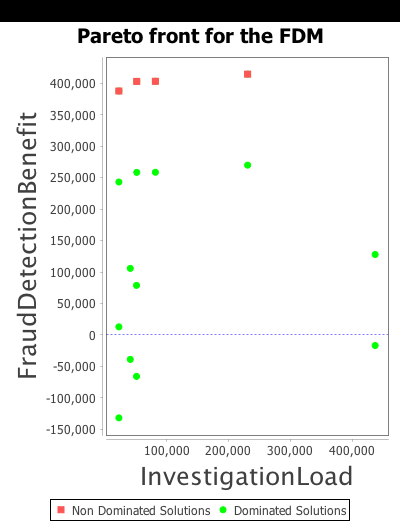
Figure 4: fraud detection model pareto front
These results show that all shortlisted solutions include the block first policy and continuous processing type. This means that, in our model, these two options outperform the investigate first policy and batch processing on both objectives.
But once these two options are selected, the shortlist includes all possible combinations of fraud detection methods and alert thresholds; each combination representing a different tradeoffs between maximising fraud detection benefit and minimising investigation load.
To visualise such tradeoffs, RADAR generates the graph in Fig. 4 plotting the objective values for the shortlised solutions (shown squares at the top of the graph) and all other non shortlisted ones (shown as circles).
Analysing information value gives the following results:
EVTPI = 220
| Parameter | EVPPI |
|---|---|
| AverageFraudValue | 122 |
| ContinuousAlertThreshold[medium] | 1.56 |
| ContinuousAlertThreshold[low] | 0 |
| ContinuousClassierTrueNegativeRate[low] | 0 |
| ContinuousAlertThreshold[high] | 1 |
| BatchClassifierTrueNegativeRate[low] | 0 |
| BatchClassifierTrueNegativeRate[medium] | 0 |
| NbrAccounts | 0 |
| BatchAlertThreshold[medium] | 0 |
| NbrFraudPerCompromisedAccountPerDay | 0 |
| BatchAlertThreshold[low] | 0 |
| CompromisedAccountRatio | 0 |
| BatchAlertThreshold[high] | 0 |
| ContinuousClassierTrueNegativeRate[high] | 0 |
| NbrLegitTransactionsPerAccountPerDay | 0 |
| BatchClassifierTrueNegativeRate[high] | 0 |
| ContinuousClassierTrueNegativeRate[medium] | 0 |
| InvestigationDelay | 0 |
The results show that except for AvarageFraudValue the information value of all model parameters is very low.
Saheed A. Busari and Emmanuel Letier, "RADAR: A lightweight tool for requirements and architecture decision analysis," in submission, August 2016
Leticia Duboc, Emmanuel Letier, David S. Rosenblum, and Tony Wicks,"A case study in eliciting scalability requirements," 16th IEEE International Requirements Engineering Conference (RE 2008), 2008, pp. 247-252.
Leticia Duboc, Emmanuel Letier, and David S. Rosenblum, "Systematic elaboration of scalability requirements through goal-obstacle analysis" IEEE Transactions on Software Engineering, vol. 39, no. 1, pp. 119-140, 2013.
D. J. Hand, C. Whitrow, N. M. Adams, P. Juszczak, and D. Weston, "Performance criteria for plastic card fraud detection tools," The Journal of the Operational Research Society, vol. 59, no. 7, pp. 956-962, 2008.