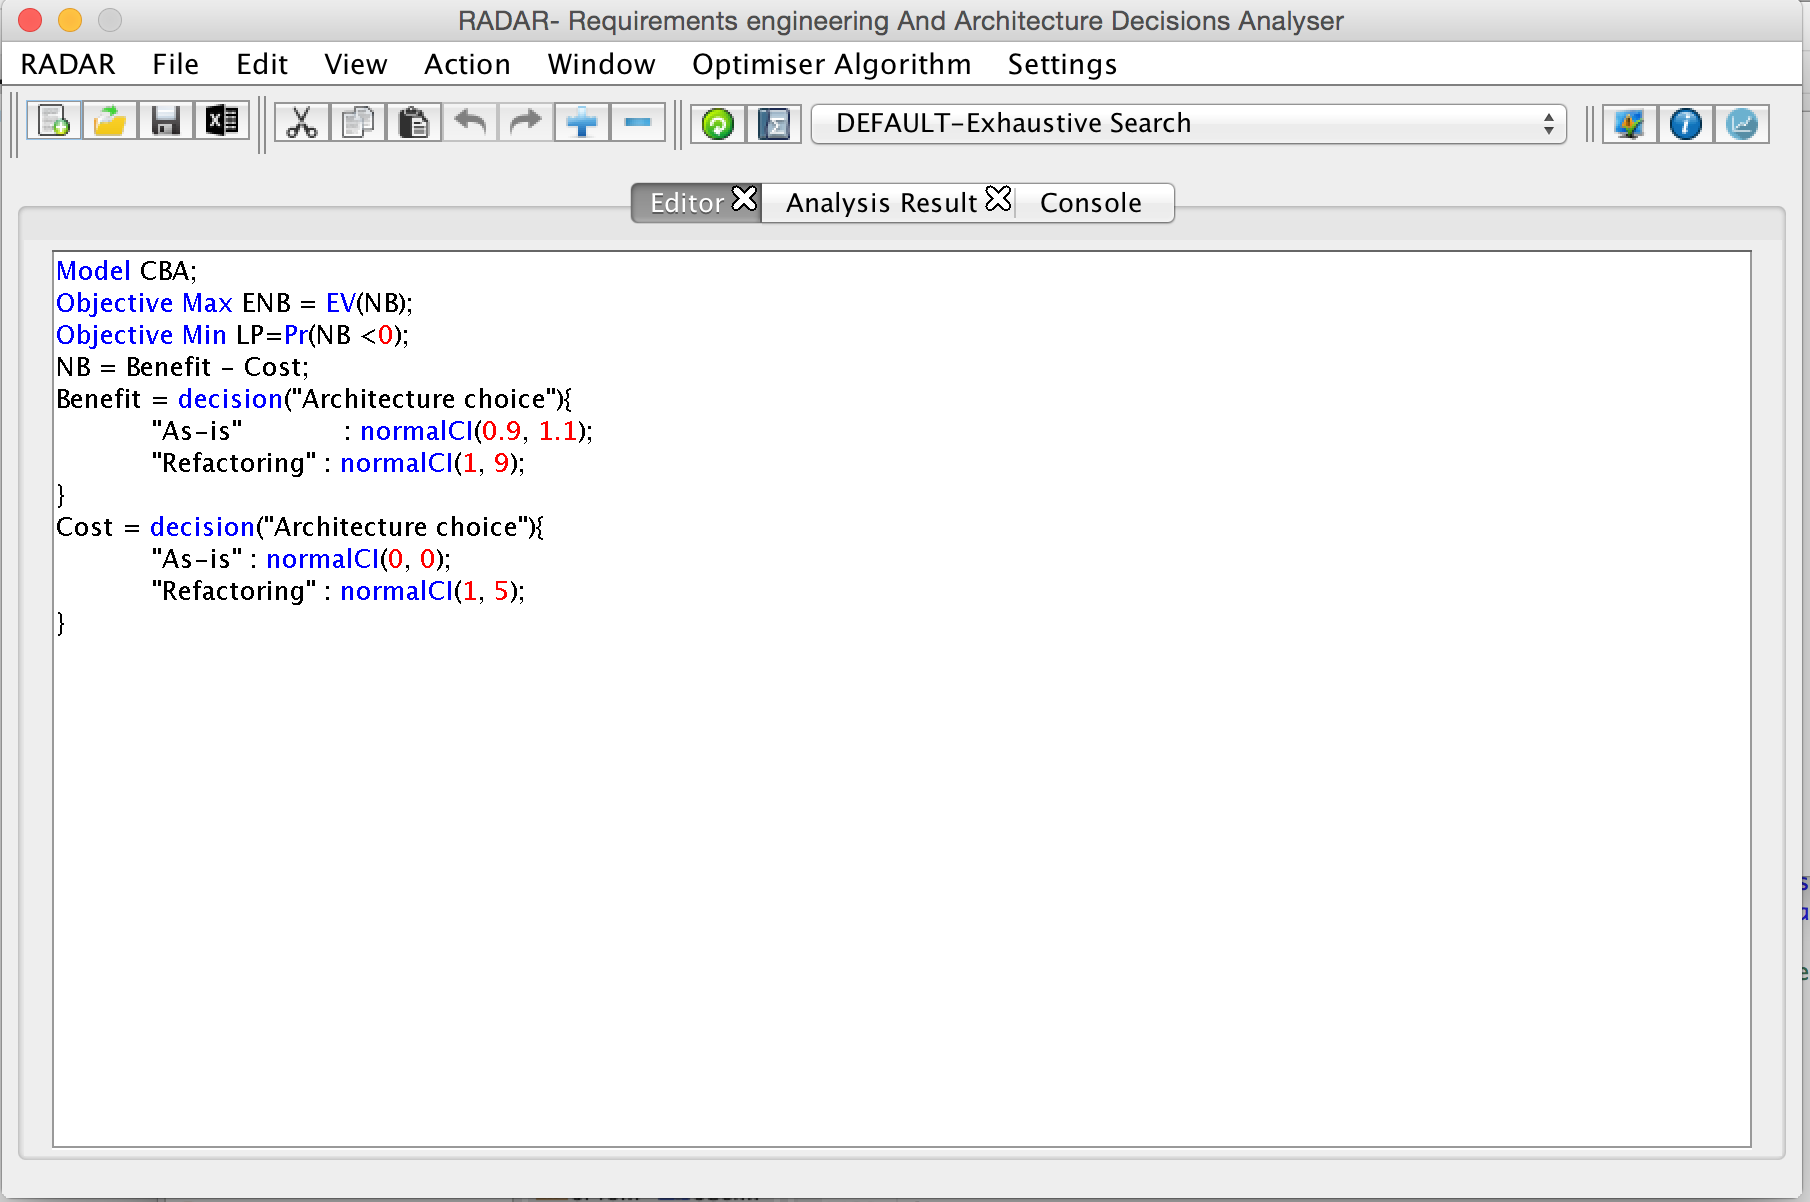
Figure 1: RADAR refactoring model example
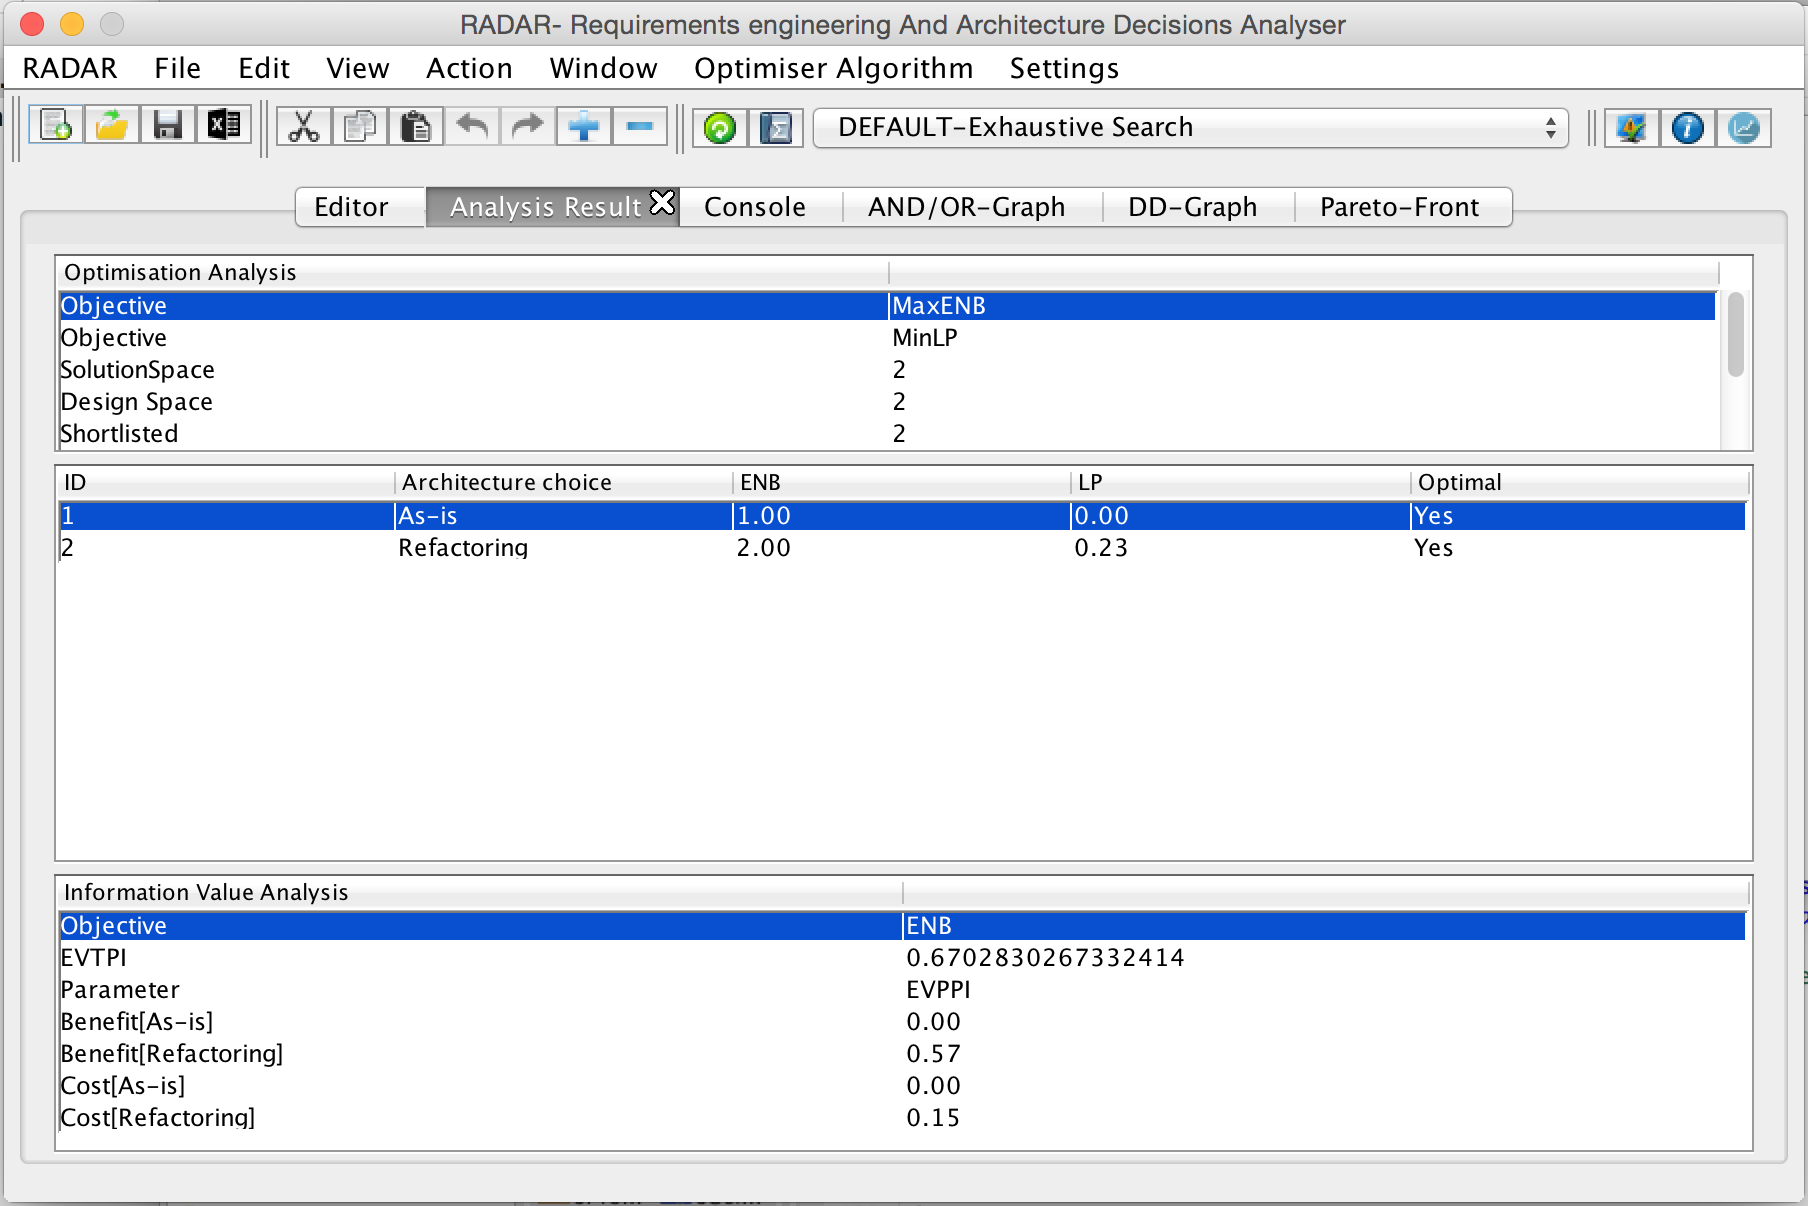
Figure 2: RADAR refactoring model analysis result
RADAR is a lightweight modelling language and automated decision analysis tool to support multi-objective decision under uncertainty in requirements engineering and software architecture.
RADAR analysis provides useful feedback to requirement engineers and software designers about:The RADAR modelling language and decision analysis support tool are described in the following research papers for publication:
RADAR: A Lightweight Tool for Requirements and Architecture Decision Analysis, published and presented published and presented in International Conference on Software Engineering (ICSE) 2017, Buenos Aires, Argentina. Authors: Saheed A. Busari and Emmanuel Letier
Towards search-based modelling and analysis of requirements and architecture decisions, published and presented in International Conference on Automated Software Engineering (ASE) 2017, Urbana Chmapaign, Illinois, United States of America. Authors: Saheed A. Busari
Modelling and Analysing Software Requirements and Architecture Decisions under Uncertainty, PhD Thesis Authors: Saheed A. Busari
The scalability analysis of RADAR desision support tool is described in the paper below:
Scalability Analysis of the RADAR Decision Support Tool. Authors: Saheed A. Busari and Emmanuel Letier
The RADAR tool is available and can be downloaded here, and all model examples used in the paper can be downloaded here.
We have also made the source code of the tool available in GitHub. The tool is implemented in Java and uses ANTLR to generate model parser, generates diagrams in DOT format , and uses Graphviz (also available in browser ) to visualise the diagrams.
RADAR is a self-contained jar file. Simply download the file to your computer and double click to launch the application (needs JRE 1.7 or later versions). Once the application is launched successfully, a window appears with three panels as shown in figure 1:
RADAR has three main tabs that displays by default when it is launched:
The Analysis Settings , shown in figure 5, is used to specify parameters for model analysis and the path where Graphviz is installed to enable visualisation of the variable AND/OR graph and decision dependency graph. Examples of these parameters includes:
Other tabs that are displayed after a successful RADAR analysis are AND/OR goal graph (figure 3), decision dependency graph (figure 4) and the Pareto-front (figure 6)
To analyse an existing model, the following steps can be followed:
RADAR also saves the following in the directory where the jar is located:
Figure 1: RADAR refactoring model example
Figure 2: RADAR refactoring model analysis result
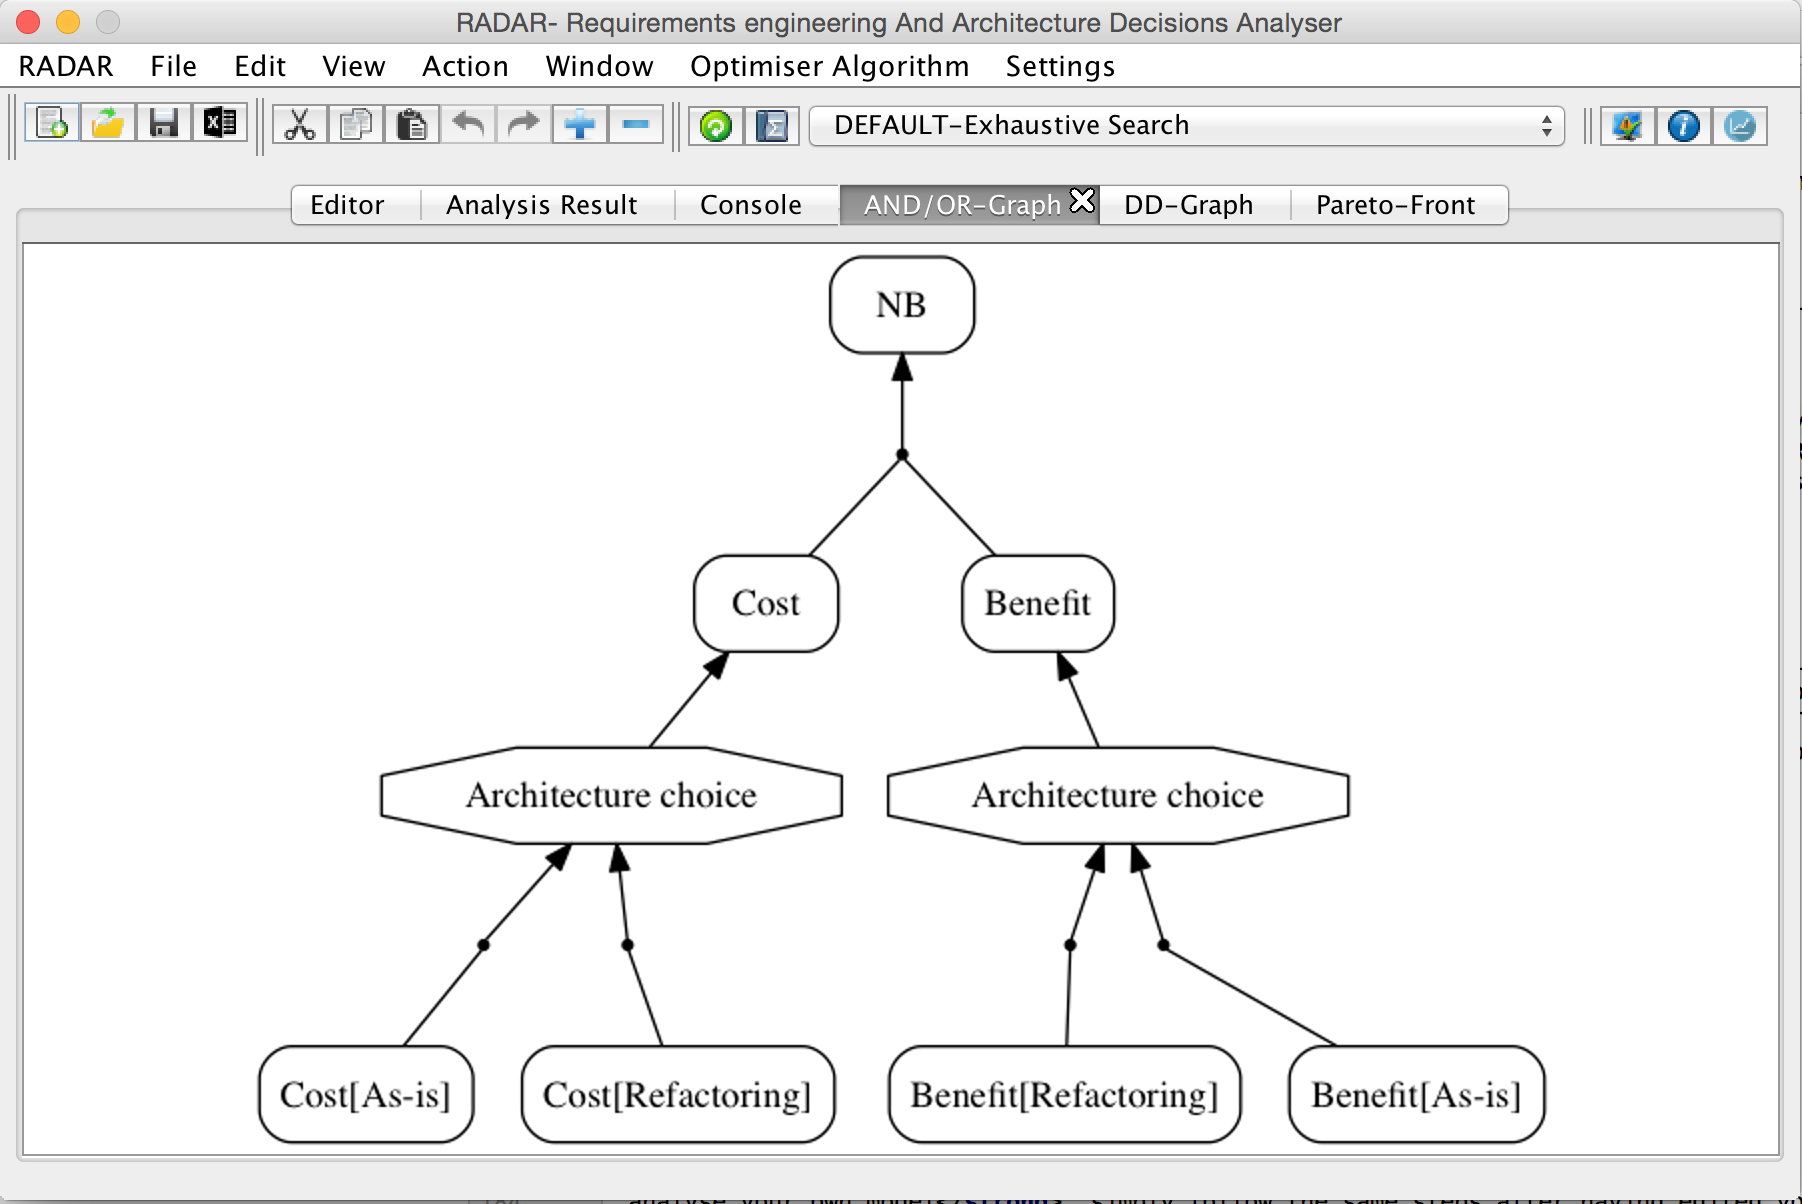
Figure 3: RADAR refactoring model AND/OR graph.
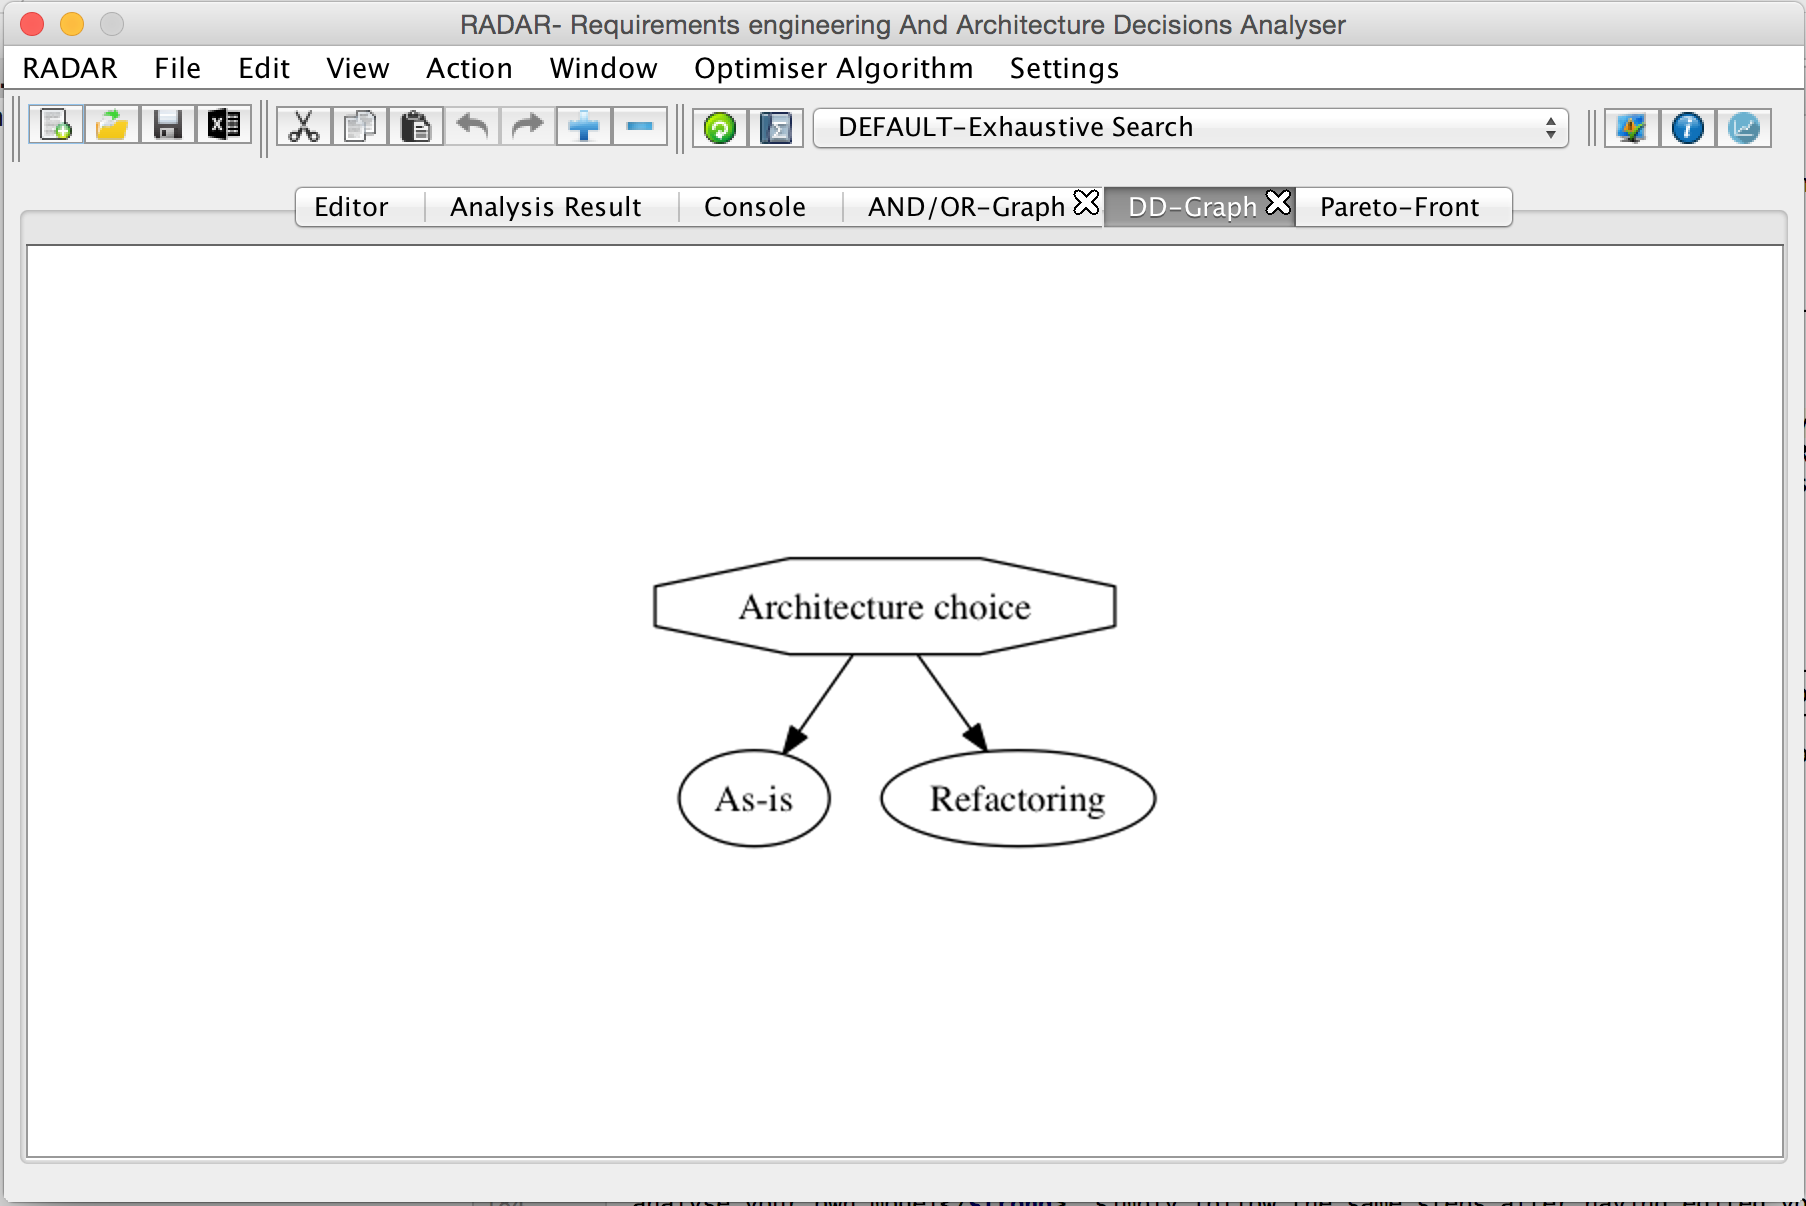
Figure 4: RADAR refactoring model decision dependency graph
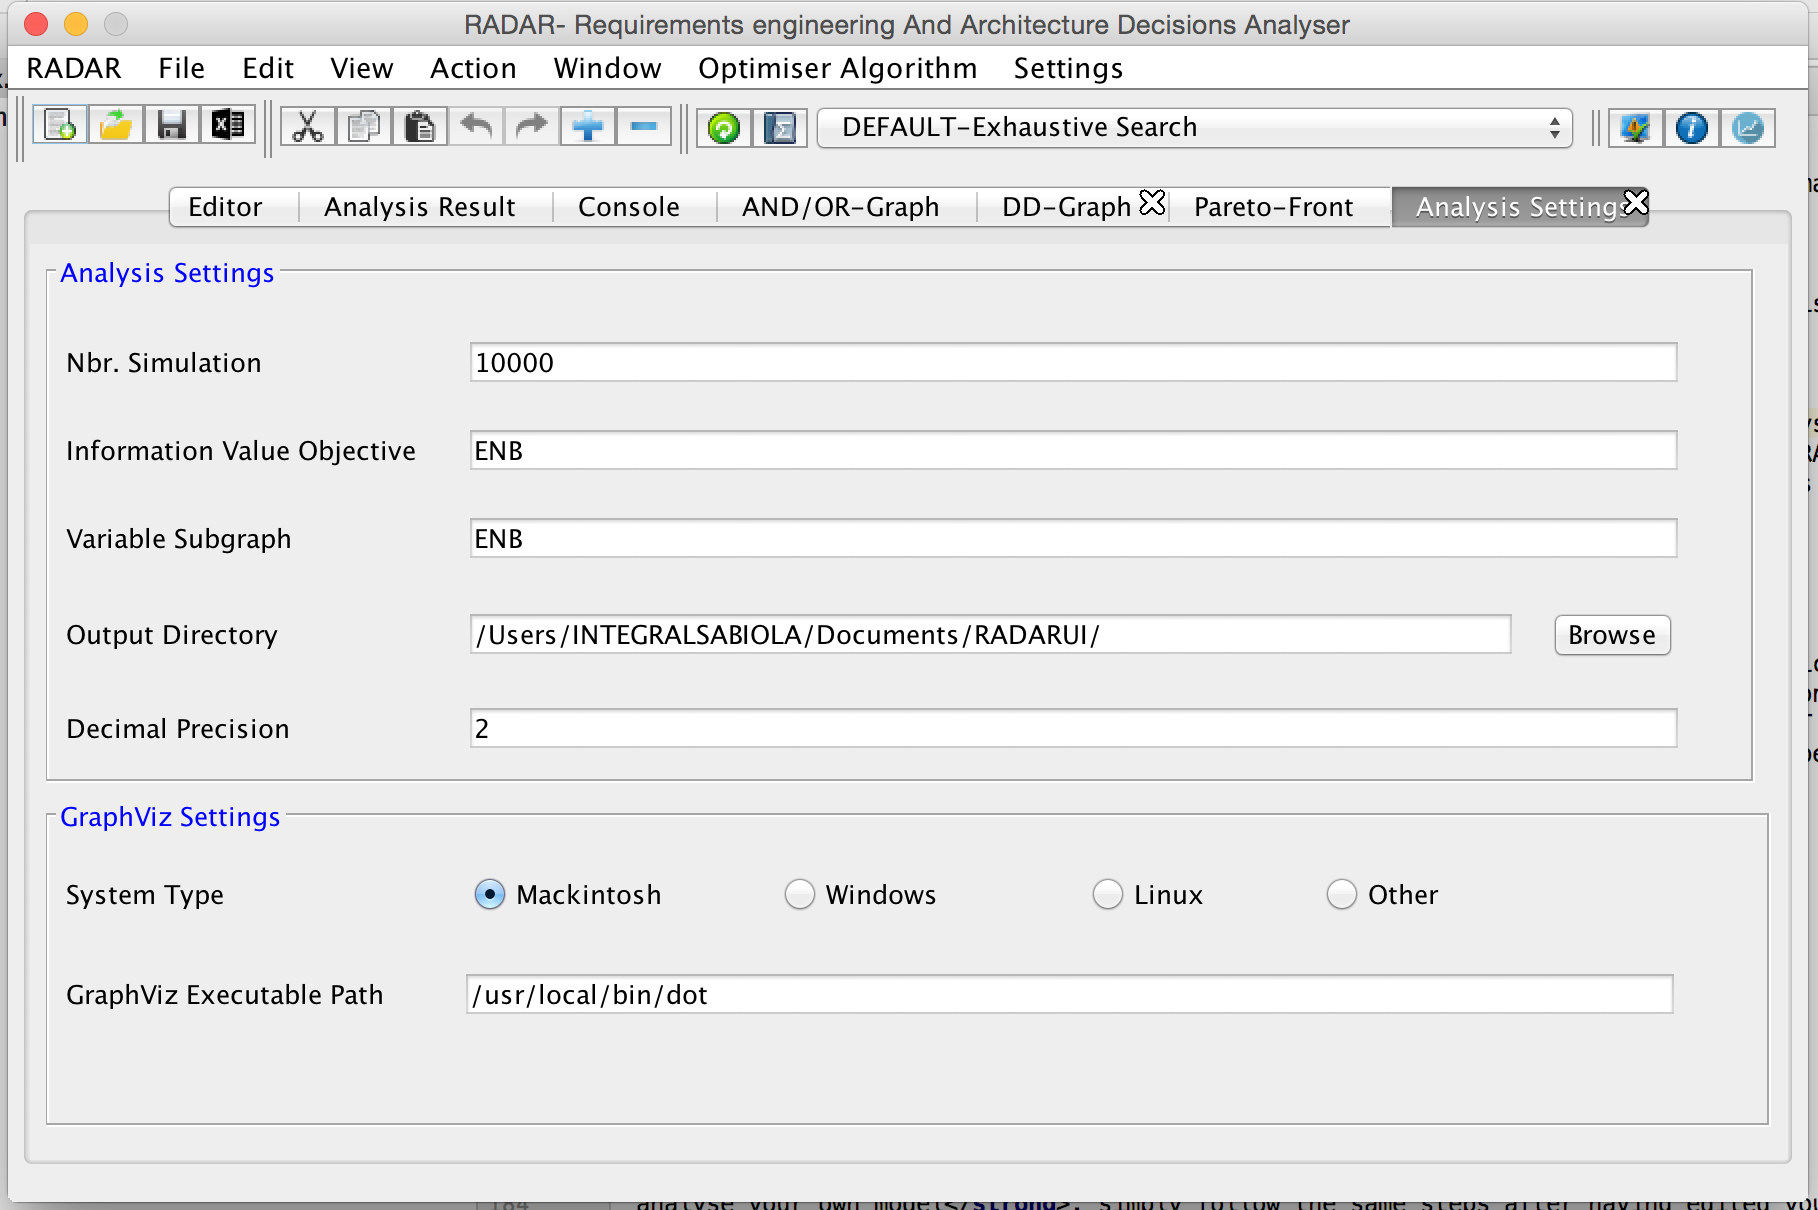
Figure 5: RADAR Analysis Settings page.

Figure 6: RADAR refactoring model Pareto front.
To analyse your own model, simply follow the same steps after having edited your model in the tool or using an external text editor.
For any question, email: {saheed.busari.13, e.letier}@ucl.ac.ukWe have applied the tool to the following examples.
| Example | Brief Description | Report | Radar File | |
|---|---|---|---|---|
| Refactoring cost-benefit analysis | The small example used in the paper to introduce the language and decision analysis method | refactoring | refactoring.rdr | |
| Plastic card fraud detection system | The running example used in the paper to illustrate the language and analysis functions. The problem consists in selecting among alternative design for a fraud detection system so as to minimise financial loss due to fraud and minimise the number of fraud alerts to be investigated manually | fraud-detection | fraud-detection.rdr | |
| Document sharing security policy | This example analyses security policy decisions for an organisation concerned with leaks of confidential information. The analysis extends previous models developed by Tristan Caulfield and David Pym for a real organistion. | sharing-policy | sharing-policy.rdr | |
| Emergency Response System | This example illustrates the use of RADAR on an architecture decision problem used in previous publications (see the report for details). The design space for this model includes 6912 solutions and takes around 2 minutes to analyse. | emergency-response | emergency-response.rdr | |
| Satellite Image Processing | This example was first introduce to illustrate the CBAM architecture decision method (see report for full references). We show here how to analyse this problem in RADAR and compare RADAR's approach to CBAM. | nasa-ecs | nasa-ecs.rdr | |
| London Ambulance Example | This example illustrates the design decisions of the London Ambulance Service. We show here how to analyse this problem with RADAR. There are 5 design decisions and the solution space id 648 and the anlaysis was completed in milli seconds. | london ambulance service | las.rdr |
We have also applied RADAR on different synthetic models to understand the scalability of the tool. The synthetic models are generated using a model generator that generates random syntactically valid RADAR models with a given number of objectives, decisions, number of options per decisions and minimum number of model variables. To create a synthetic model of a specific size, download the model generator jar file and run the command below:
In the command above, SytheticModelGenerator.jar is the program that generates the synthetic model and SyntheticModel.properties stores values for the RADAR model constructs, such as the number of objectives, decisions, number of options per decisions and minimum number of model variables. The file SytheticModel.rdr contains a synthetic RADAR model with decision dependency and has 2 objectives, minimum of 10 model variables, 4 decisions with their corresponding options ranging between 2 and 3.
The RADAR files can be opened and analysed in the tool following the steps outlined above.